- We have seen
yields on the Singapore T-bills increasing with the US Fed Funds Rate.
- Qsovs are great
as an alternative to T-bills given the low-risk, but doesn’t offer much yield
pick-up.
- We have some options of Tier 2 Corporate bonds that has strong credit issuer rating while offering an attractive yield pick-up over the T-bills.
A quick recap on the interest rate changes
Chart 1
US Fed Funds Rate and Singapore 6-month T-bills
yield (%)
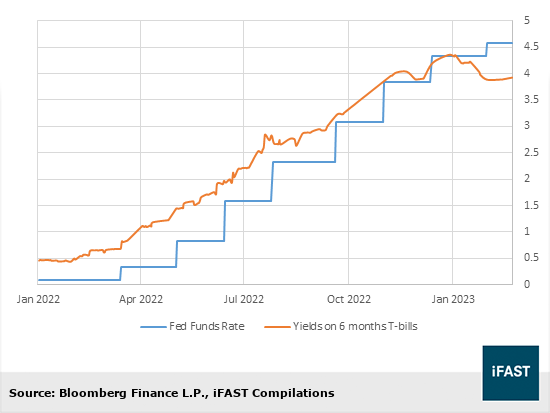
Elevated inflation, far past central banks’ internal targets, forced their hands into raising interest rates to unseen levels. The forerunner leading the global trend is the US Federal Reserve, which saw its Fed funds rate going from 0.25% to the current 4.75%. Singapore – not spared from this rising interest rates environment – saw our 6-month T-bills rising alongside the Fed funds rate.
Since December 2022, we have seen some divergence in the movements between the yields on the 6-months T-bills and the Fed funds rate, whereby yields on the T-bills eased slightly while the Fed funds rate continued to climb. However, as inflation looks to remain strong in the US, uncertainty in the terminal Fed funds rate might continue to drive yields on the 6-months T-bills even higher.
Undeniably, the current environment for the interest rates significantly promotes investors to consider the T-bills given their “risk-free” nature and yields not seen in the past decades. We favour short-dated bonds for lesser exposure to interest rate risks, and strong credit issuer ratings given the impending economic outlook. But we do acknowledge that some investors are seeking longer term options due to their investment time horizon, looking at performances comparable to the T-bills while having strong credit ratings to their names.
In an article previously published (Idea of the Week: Here are some alternatives to Singapore Government Bonds), we had highlighted primarily Temasek-linked retail issues and quasi-sovereign issues. In this issue, we wish to place the spotlight on several corporate bonds with strong issuer credit ratings of A and above, while offering attractive yields above the T-bills.
It ought to be noted that while these issuers have some of the strongest credit ratings available in the SGD debt market (that is not quasi-sovereign), it pales in comparison to that of the Singapore Government at AAA/AAA/Aaa by S&P/Fitch/Moody’s respectively. The silver lining is the slightly higher yields offered on these issues, given the additional risks undertaken.
Qsovs: Good but not enough
While quasi-sovereign issues might be the best alternatives to T-bills given the risk exposure, we currently see minimal yield pick-ups over the T-bills (from Table 1). With 6-months T-bills and 1-year T-bills yielding 3.96% and 3.92% respectively as of 2 March 2023, most quasi-sovereigns are only good for consideration if investors would want to lock in the current T-bill yields with longer maturity term – given that issuance yield on T-bills are subjected to the interest rates environment, as observed to be highly volatile in the past few months.
Table 1
Top performing quasi-sovereign issues as of 3
March 2023
|
Issue |
Ask Price |
Years to Maturity |
Yield to Worst |
|
96.771 |
2.27 |
4.185 (% p.a) |
|
|
91.677 |
3.73 |
4.125 (% p.a) |
|
|
100.061 |
4.65 |
4.119 (% p.a) |
|
|
91.816 |
4.04 |
4.117 (% p.a) |
|
|
98.108 |
4.61 |
4.116 (% p.a) |
|
|
Sources: Bondsupermart, iFAST Compilations. Data as of 3 March 2023. |
|||
Corps: Higher yields come with a risk premium
We have selected some of the corporate bonds with the strongest issuer ratings available, yet at the same time offering relatively attractive yields over the T-bills.
Table 2
Issuers with strong credit ratings
|
Issues |
Issuer Rating (S&P/Fitch) |
Bond Rating (S&P/Fitch) |
Ask Price |
Ask Yield to Call/Maturity |
Years to call/maturity |
Reset Rate |
|
AA-/AA- |
NR/A |
99.08 |
4.54%/4.20% |
0.99/5.99 |
5Y SGD SOR + Initial Spread (1.08%) |
|
|
AA-/A+ |
BBB+/A- |
99.25 |
4.67%/4.70% |
4.75/9.75 |
5Y SORA OIS + Spread (1.743%) |
|
|
A+/ A+ |
BBB+/ A- |
101.88 |
4.77%/5.20% |
4.36/9.36 |
5-year SORA OIS + Initial Margin (2.683%) |
|
|
A+/ A+ |
BBB/A- |
99.22 |
5.03%/4.85% |
4.99/9.99 |
Prevailing 5Y SORA-OIS + Initial Margin [1.634%] |
|
|
A/A |
A-/BBB+ |
99.63 |
4.74%/4.74% |
4.52/9.52 |
5YR SORA OIS + Initial Spread (1.751%) |
|
|
Sources:
Bloomberg Finance L.P., Bondsupermart, iFAST Compilations. |
||||||
While these issues appear to offer a substantial yield pick-up over the “risk-free” T-bills, these coincidentally are all Tier 2 (“T2”) securities of various banks. As such, we wish to highlight certain features and risks pertaining to T2 securities under financial companies,
- T2 securities are subjected to loss absorption upon trigger, although the CET1 and AT1 instruments would be utilised first prior to the activation of T2 securities for loss absorption.
- Under the Basel III framework for T2 capital (Article 64 of the Regulation (EU) No 575/2013), T2 securities that remain uncalled past the first reset date will have to be amortized in the balance sheet of the company. This also means that there is an incentive for the banks to call back on their T2 securities and to re-issue new T2 securities to ensure capital remains sufficient on their balance sheet.
- Redemption of the T2 securities on the first call date is generally subjected to approval by the relevant authorities, which depends on the underlying liquidity that the bank possesses.
- First reset date coincides for these bonds on the first call date, which in the determination of yield to maturity taking into account the reset rate, it was assumed for 5-year SORA-OIS and 5-year SGD SOR to be 3% (the actual numbers are at 3.58% and 3.8785% as of 3 March 2023 respectively.)
To have a better overview of the respective strengths of each company, below we cover a summary of the recent financials of each issuer.
UOBSP
For the full year ended 31 December 2022 (“FY22”), United Overseas Bank Limited (“UOB”) saw its core net profit at SGD 4.8b, which is an 18% increment from FY21. A large reason for the rise in net profit is due to the net interest income, which rose by 31% to SGD 8,343m in FY22, from SGD 6,388m in FY21. For the total income, it was recorded at SGD 11,575m in FY22, an increase of 18% from the SGD 9,789m recorded in FY21. Of note, its total expenses rose significantly in FY22 as well, from SGD 4,313m in FY21 to SGD 5,016m in FY22 – despite cost/income ratio falling from 44.1% in FY21 to 43.3% in FY22.
In FY22, UOB completed the acquisition of Citigroup’s consumer portfolio in Malaysia and Thailand on 1 November 2022, while Indonesia and Vietnam’s portfolios are expected to come onboard in 2023. As a result, for UOB’s credit profile, its CET1 ratio fell slightly from FY21 after the acquisition, falling 0.2% to 13.3% as of 31 December 2022. On the bright side, the non-performing loans ratio remained at 1.6% inclusive of Citi’s acquisition, remaining at the same level as the previous year. The liquidity coverage ratio increased substantially from 133% in FY21 to 147% in FY22.
ANZ
For the full year ended 30 September 2022 (“FY22”), Australia and New Zealand Banking Group Limited (“ANZ”) saw its cash profit after provisions increasing from AUD 6,198m in FY21 to AUD 6,198m in FY22, an increment of 5%. Its return on equity saw an increase of 47 basis points (“bps”) from FY21 figures of 9.9% to 10.4% in FY22. In FY22, ANZ retains its total provision release, despite decreasing significantly from AUD 567m in FY21 to AUD 232m in FY22. In 2022, ANZ has successfully acquired Suncorp Bank from Suncorp Group Limited pending authorities’ approval, which serves to expand the scale and diversification of the business operations of ANZ –ANZ expects an increase of 17% in total gross loans and advances.
Coming to its credit profile, as of 31 December 2022, ANZ saw its APRA Level 2 CET1 ratio coming down slightly to 12.2%, below the CET1 ratio of 12.3% as of 30 September 2022. On the other hand, inclusive of the Suncorp Bank acquisition, the pro-forma CET1 ratio of ANZ is expected to fall to approximately 11.0%. Total provisions continue to see a release of 5 bps instead of positive charges, for a total AUD 83m release of provisions. The gross impaired assets by division fell to 0.16% as of 31 December 2022, from 0.21% observed as of 30 September 2022.
BNP
For the full year ending 31 December 2022 (“FY22”), BNP Paribas SA (“BNP”) reported strong growth in all of its divisions. Corporate and Institutional Banking (“CIB”) revenues grew by 15.7%, Commercial, Personal Banking & Services (“CPBS”) revenues grew by 9.3% and Investment & Protection Services (“IPS”) revenues grew by 3.0%. Overall revenues grew 9.0% year-over-year (“yoy”) to EUR 50.4b while net income grew 7.5% yoy to EUR 10.2b. From the increase in interest rates, net interest income from CPBS saw strong growth while both CIB and IPS saw continued growth despite challenging market conditions.
For FY22, the CET1 ratio for BNP was at 12.3%, an increase of 20 bps from 3Q22. After the closing of the sale of the Bank of the West, the CET1 ratio is expected to improve by ~170 bps in the next financial quarter. The sale of Bank of the West to BMO Financial Group was completed on 1 Feb 23 and this will release ~EUR 11.6b of CET1 capital. The liquidity coverage ratio was at 129%, well above regulatory requirements. Liquidity reserve as of FY22 was EUR 461b, which provides headroom for BNP in terms of wholesale funding for more than 1 year.
ACAFP
For the full year ending 31 December 2022 (“FY22”), Credit Agricole S.A. (“ACAFP”) revenues grew 4.8% yoy to EUR 23.7b while net income grew 0.9% yoy to EUR 6.3b. For FY22, all business divisions for ACAFP saw revenue growth from strong business momentum. In 2022, ACAFP gained 1.9m new customers in its retail banking division in France, Italy and Poland. For FY22, Credit Agricole managed to achieve all of its 2022 targets. Looking forward, we expect ACAFP to reach and achieve its 2025 medium-term plan targets.
As at FY22, the CET1 ratio for ACAFP was 11.2% which is 330 bps (“bps”) above regulatory requirements. At the group level, CET1 ratio for Credit Agricole Group was 17.6%, its buffer of 890 bps above regulatory requirements is the largest among GSIB (“globally systematically important bank”) peers. As at FY22, ACAFP had EUR 467b of liquidity reserves of which EUR 197b were cash and central bank deposits and EUR 115b were high quality liquid assets. The liquidity coverage ratio was 167.3%, well above the 100% requirement.
WSTP
For the full year ended 30 September 2022 (“FY22”), Westpac Banking Corporation (“Westpac”) saw its net operating income fall 8% from AUD 21,222m in FY21 to AUD 19,606m in FY22. However, it saw an increase in net operating profit instead, increasing from AUD 5,463m to AUD 5,699m in FY22. This is mostly due to a significant decrease in the operating expenses observed in FY21 at AUD 13,311m, which fell by 19% to AUD 10,802m in FY22. On the other hand, it saw a credit impairment charge of AUD 335m in FY22, as compared to a credit impairment benefit of AUD 590m in FY21, which Westpac attributed to higher inflation, rising interest rates and expectations of slowing economic activity.
Looking at its credit quality, as of 31 December 2022, Westpac’s APRA CET1 ratio is at 11.13%, slightly falling from the 11.3% observed as of 30 September 2022. On an internationally comparable basis, Westpac’s CET1 ratio is at 17.4%. Its liquidity cover ratio rose from 132% as of 30 September 2022 to 139% as of 31 December 2022, while its net stable funding ratio remains relatively unchanged at 122%. Both remain well above the regulatory requirement of 100%.
Conclusion
While these bonds do not constitute alternatives to T-bills considering the difference in risk undertaken, these remain great options for those seeking strong credit quality in issuers while willing to take slightly higher risk for higher yields. On the other hand, these options provide for a longer term to maturity, for investors seeking a slightly longer time horizon.
Declaration: For specific disclosure, at the time of publication of this report, IFPL (via its connected and associated entities) holds a position in ANZ 4.500% 02Dec2032 Corp (SGD), UOBSP 4.250% Perpetual Corp (SGD) and UOBSP 2.550% Perpetual Corp (SGD), and the analyst who produced this report holds a NIL position in the abovementioned securities.
Our podcast series, Yield Hunters, is available on Spotify, iTunes Podcasts and Google Podcasts. We share our thoughts on new bond issues and hold discussions on the fixed income space. Listen to our latest episode below and follow us!